


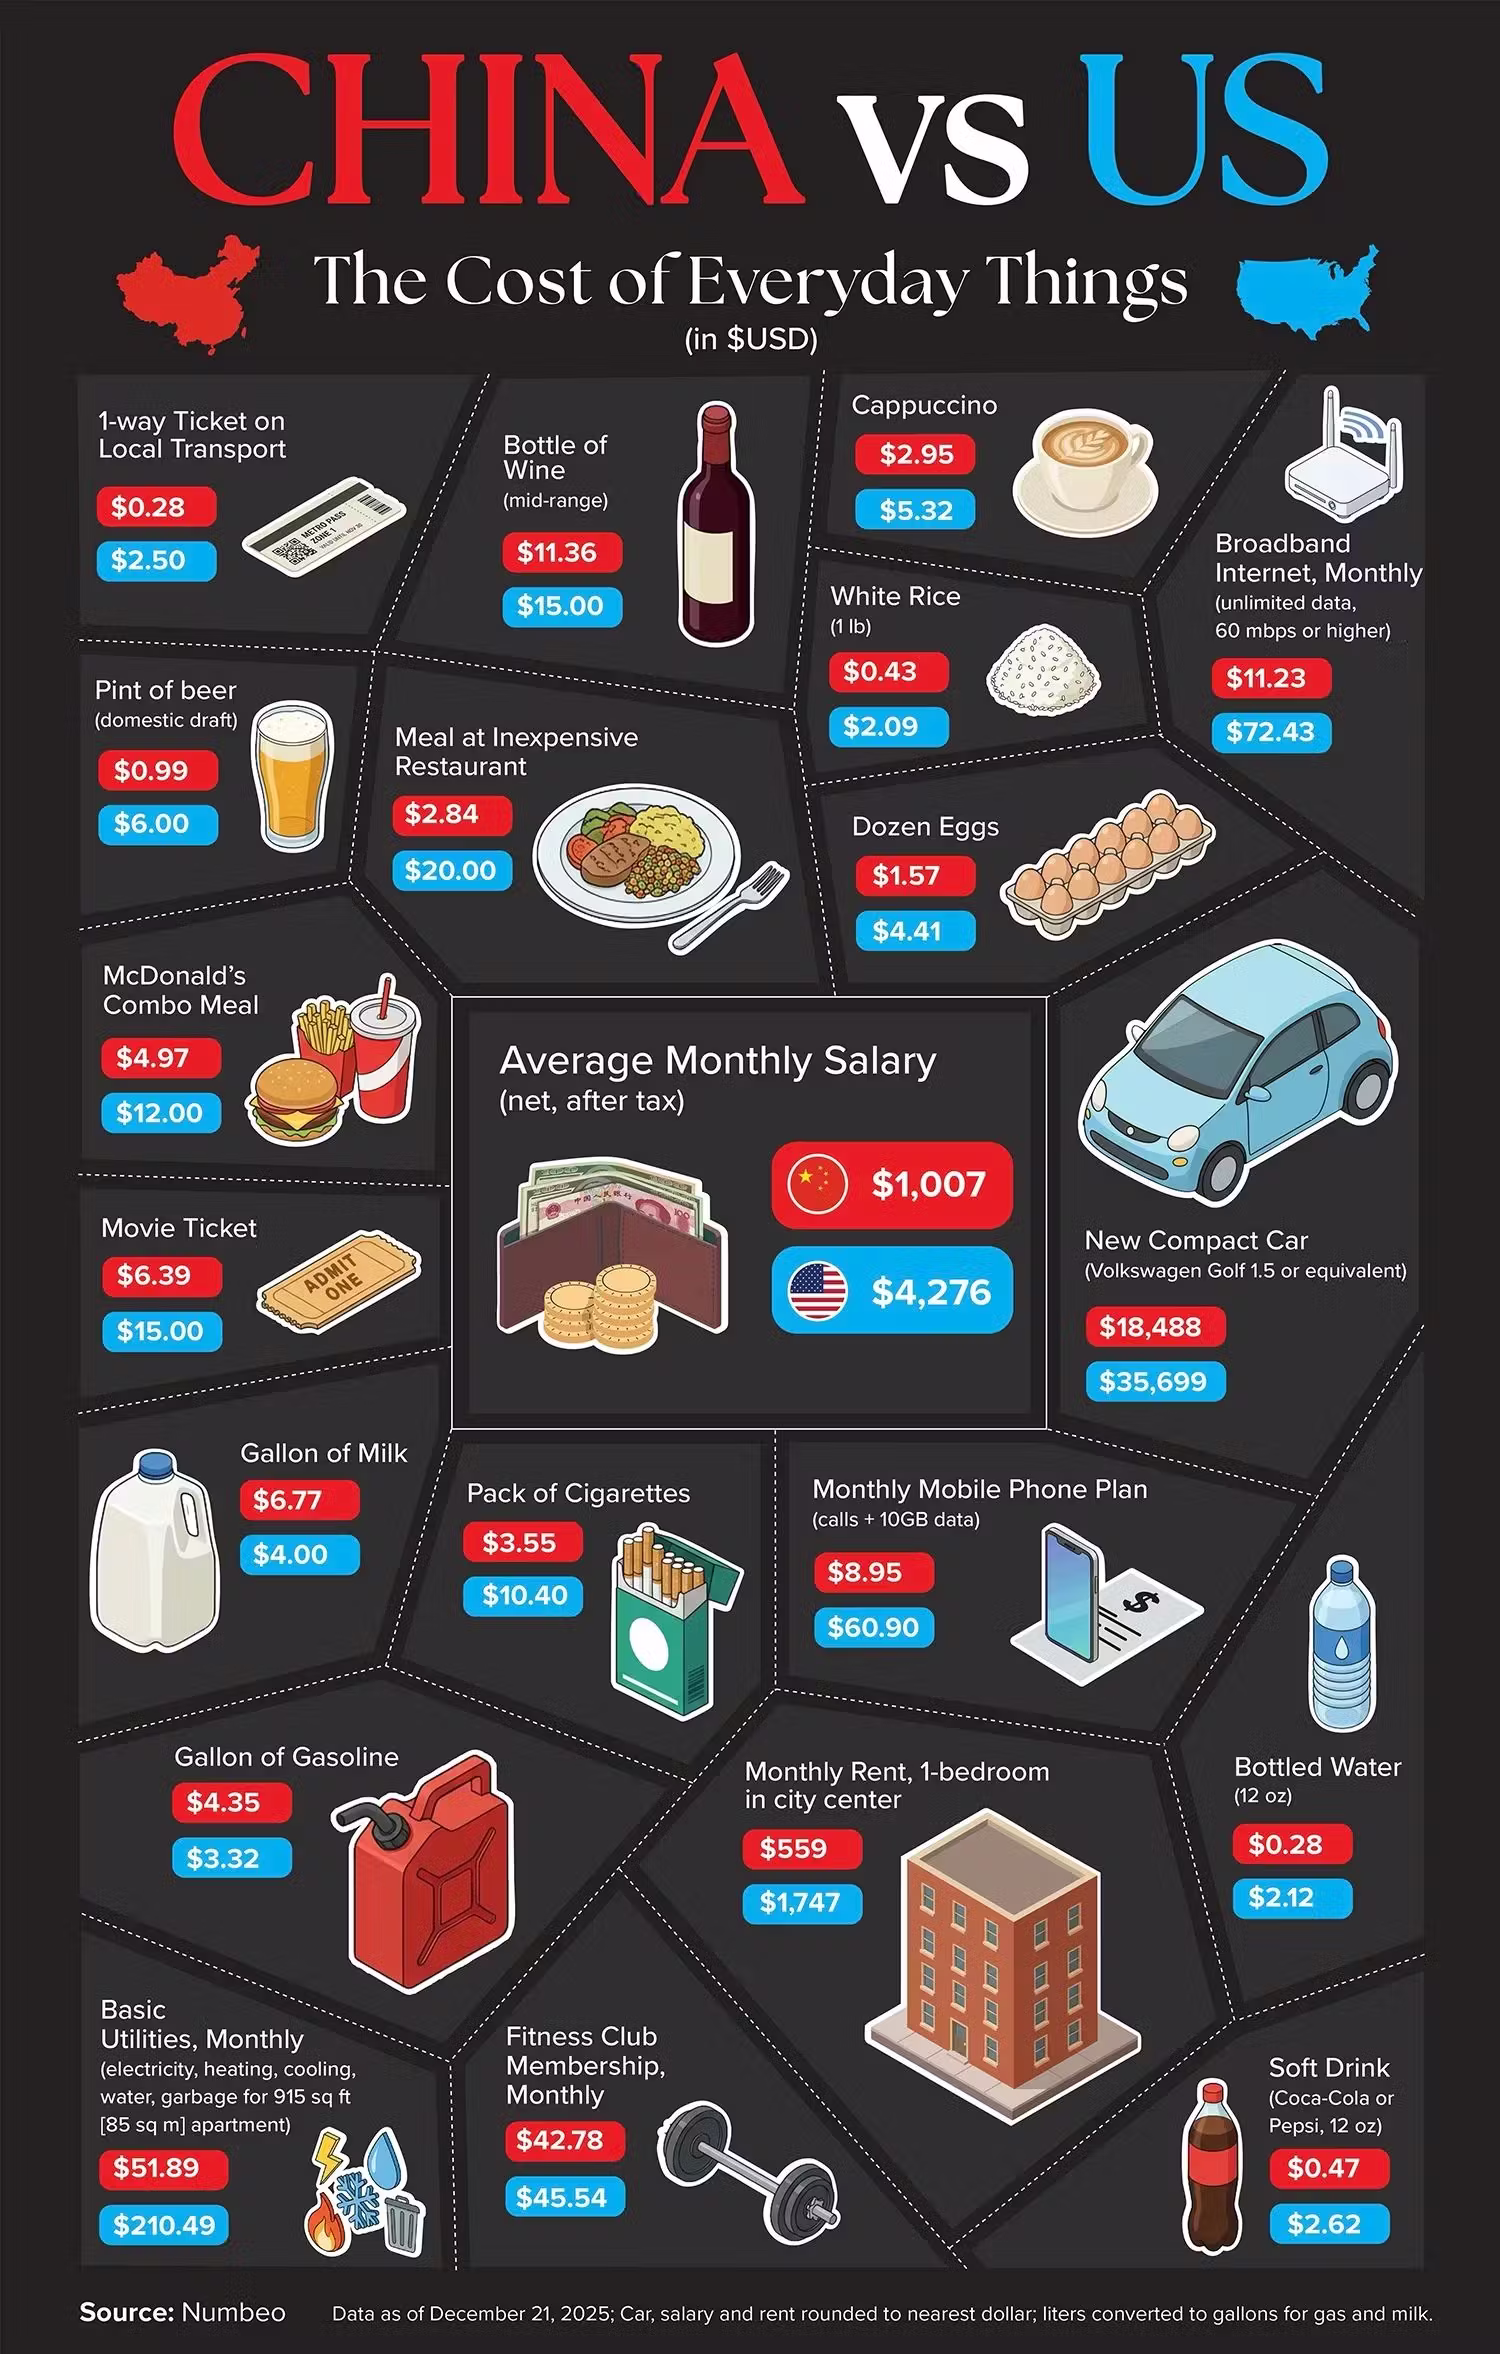
(Featured graphic: Cost of Everyday Things, China vs United States – Source: Numbeo)
At first glance, the graphic above feels almost unbelievable.
A cappuccino for under $3.
Rent in a city center for $559.
A full restaurant meal for less than $3.
Meanwhile in the U.S., many of those same basics cost two, three, or even four times as much.
But this comparison isn’t meant to provoke outrage or fuel simplistic “which country is better?” debates. Instead, it’s an invitation to step back and ask a more useful question:
What actually determines quality of life – and what do these numbers leave out?
Sticker Shock Is Real – But So Is Context
There’s no denying the headline takeaway:
Everyday goods and services are dramatically cheaper in China than in the United States.
Transportation, food, rent, utilities, and mobile service all come in far lower. Even big-ticket items like cars cost significantly less.
But the graphic also includes a crucial data point that often gets ignored in viral comparisons:
Average monthly salary (net, after tax):
- China: $1,007
- United States: $4,276
Lower prices exist alongside lower incomes. What matters isn’t the absolute price of milk or rent – it’s how many hours of work it takes to afford them.
Purchasing Power: The Missing Middle
This is where comparisons often break down.
In China:
- Essentials are cheaper
- Savings rates are often higher
- Housing costs (outside top-tier cities) are relatively contained
In the U.S.:
- Wages are higher
- Costs are significantly higher
- Many expenses (healthcare, housing, education) are unpredictable or debt-financed
The result is a paradox many Americans feel intuitively but struggle to quantify:
Earning more doesn’t necessarily feel like living better.
What the Graphic Doesn’t Show
Price charts can’t capture the full picture. Some important omissions:
- Healthcare access and cost
- Job mobility and labor protections
- Political freedoms
- Environmental quality
- Rural vs urban inequality
- Social safety nets
- Home ownership feasibility
- Long-term financial security
China and the U.S. optimize for very different systems – and those systems reward different tradeoffs.
Why These Comparisons Still Matter
Even with all the caveats, this data is worth paying attention to.
Because the story isn’t really about China.
It’s about a growing realization in the U.S. that:
- Housing has outpaced wages
- Everyday costs feel detached from value
- “Doing everything right” no longer guarantees stability
When people react strongly to charts like this, it’s often less about envy – and more about frustration with their own economic reality.
The Question Worth Asking
Instead of arguing over which country is “winning,” a better question might be:
Why do so many people feel financially squeezed despite record productivity and technological progress?
That question applies everywhere – but especially in places that promise opportunity as a defining feature of national identity.
What about Context?
Data comparisons can mislead when stripped of context – but they can also illuminate uncomfortable truths when viewed honestly.
The goal isn’t to idolize one system or demonize another.
It’s to recognize where everyday life is getting harder, and ask why – before those pressures become the norm rather than the warning sign.
Where This Data Comes From
The centerpiece image uses figures sourced from Numbeo’s 2025 cost-of-living dataset, one of the largest crowdsourced cost databases in the world. Numbeo aggregates user-submitted prices for things like rent, groceries, transportation, and utilities – then compares them across countries. Numbeo
According to Numbeo:
- The overall cost of living (including rent) in the U.S. is much higher than in China, with prices often 50–60% higher on average. Numbeo
- City-level comparisons (e.g., Beijing vs. Los Angeles) show similar patterns: U.S. city costs and rent are substantially higher. Numbeo
Other sites that summarize the same underlying data report China’s cost of living as roughly 45% lower than the U.S. overall. ICG Resources
📌 Overall Cost of Living Differences
🏙️ China Is Significantly Cheaper Overall
- On average, the cost of living in China is about 53–57% lower than in the United States when comparing daily expenses like food, transportation, and housing. MyLifeElsewhere
- Another analysis finds that overall living costs with rent are roughly 140% higher in the U.S. compared to China. Living Cost Index
💰 Income & Purchasing Power
💵 Average Salaries After Tax
- The Numbeo dataset (also used in your graphic) shows average monthly net salary of about $1,007 in China versus $4,276 in the U.S. Visual Capitalist
- Other aggregated data sources also reflect this pattern: U.S. after-tax earnings are several times higher than China’s. Livingcost
🧠 Local Purchasing Power
Even with lower prices, Americans generally enjoy greater local purchasing power – meaning more income relative to the cost of essentials. nationmaster.com
🏠 Housing & Utilities
🏡 Rent and Utilities
- A one-bedroom city-center apartment costs around $559/month in China vs. $1,747 in the U.S. in the Numbeo dataset – a nearly 70% price gap. Visual Capitalist
- Basic utilities (electricity, water, garbage) are often 3–4x cheaper in China. Visual Capitalist
- Broader cost indexes suggest overall rental costs are about 130% higher in the U.S.. Living Cost Index
🍔 Everyday Goods & Services
Here’s how common items compare:
🍽️ Eating Out
- A meal at an inexpensive restaurant costs about $2.84 in China vs. $20 in the U.S. Visual Capitalist
- Even a cinema ticket is cheaper in China (~$6.39 vs. $15). Visual Capitalist
🥛 Grocery Prices
- Rice (1 lb) is about $0.94 in China vs. ~$4.60 in the U.S.. Numbeo
- Eggs (12) cost roughly $1.59 in China vs. $4.41 in the U.S.. Numbeo
- Some items – like milk or gasoline – can actually be more expensive in China, depending on local production and import costs. Visual Capitalist
📶 Services & Connectivity
- A monthly broadband internet plan is often ~6x cheaper in China (~$11) than in the U.S. (~$72). Visual Capitalist
- A standard mobile phone plan is also much cheaper in China. Visual Capitalist
🚆 Transportation
- A local public transit one-way ticket costs around $0.28 in China vs. $2.50 in the U.S.. Visual Capitalist
- Gasoline prices vary by data source, but some measurements show China’s gas can be comparable or even higher than U.S. averages. Numbeo
🧮 Sector-Level Cost Differences (From Other Comparisons)
According to broader aggregated cost calculators:
- Restaurants cost ~77% less in China. MyLifeElsewhere
- Transportation can be ~40% cheaper. MyLifeElsewhere
- Housing expenses are ~80% cheaper in China. MyLifeElsewhere
(These figures come from independent cost-of-living comparison tools that use crowdsourced price data.) MyLifeElsewhere
📍 Takeaways You Can Use in the Article
Here are ready-to-quote facts:
- China’s overall cost of living is about half (or less) of the U.S. across broad spending categories. MyLifeElsewhere
- Average earnings in the U.S. are multiple times higher, but prices rise with them. Livingcost
- Rent, utilities, and connectivity costs are dramatically lower in China, sometimes 3–6x cheaper. Visual Capitalist
- Everyday items like rice, restaurant meals, and transport are substantially cheaper in China, although certain groceries or fuel may buck the trend.